
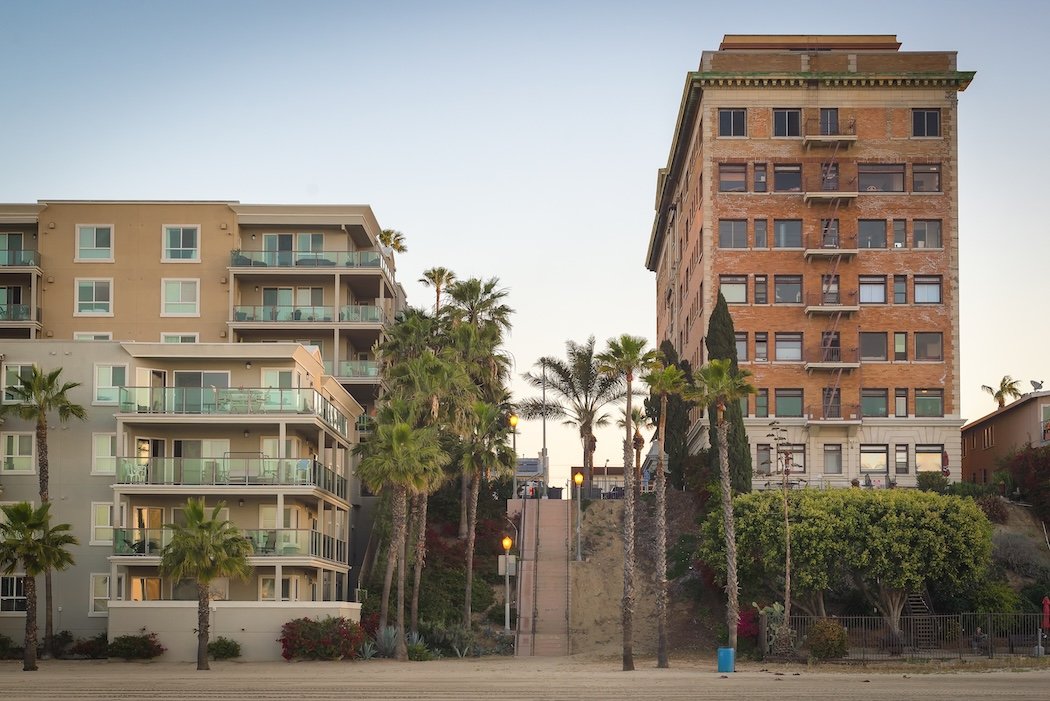
Los Angeles addressed housing affordability concerns Nov. 12, lowering the maximum annual rent increase for rent-stabilized apartments to 4%, easing worries of financially strapped residents – and likely reducing the development of new properties.
The Los Angeles City Council approved the cap-rate for apartment communities built before 1978, affecting almost half of residents, many who are struggling with housing costs.
More than half of Los Angeles renters (56%) are cost-burdened, spending at least half of their household income on housing, according to the Harvard University Joint Center for Housing. And about one in 10 of renters spend at least 90% of their income on rent, according to the Los Angeles Housing department.
LOWER RENTS, LONGER DELAYS FOR REPAIRS
The City Council vote – two councilmembers wanted a higher cap – is the biggest change in four decades for rent-stabilized housing in Los Angeles.
The annual recent increase will be 1% to 4%, compared to the previous limit of 3% to 8% — and as much as 10% if the landlord pays utilities.
Multifamily property owners and landlords, especially those with much smaller apartment buildings, said the 4% cap rate could cause significant delays in repairs – and developers will hold off on new projects.
The average rent for a one-bedroom apartment is $2,100, though rent-stabilized units often have lower rents, according to Zillow.

ADOBE STOCK
Bigger paychecks, lower rates boost Q3 affordability rate slightly. But you will still need to earn $220,000 in most cities
Fewer buyers, slightly lower mortgage rates and much-smaller price increases helped improve affordability a but during the third quarter.
About one of every six (17%) of households could afford to buy the median-priced home in the state, compared to 15% in the second quarter – and up from 16% a year ago, according to the California Association of Realtors.
But affordable is misleading, since the average buyer would need to earn at least $223,6000 – and make a monthly mortgage payment of $5,590 – based on a 20% down payment for a fixed, long-term loan.
BAY AREA MORE AFFORDABLE THAN SOCAL
The current affordability rate is just a tick from the record-low, and one-third the 56% rate in third-quarter 2012, when the housing market – and home prices – were recovering from the Great Recession.
Higher income and lower rates helped boost the affordability rate in 38 of the 53 counties surveyed. Ten counties had a decline in the affordability rate.
The Central Coast, from Santa Barbara to Santa Cruz, was the least affordable in the state, with Monterey County at a dismal 9%. Los Angeles and Orange counties affordability rates were also in the low teens (see table, below).
The Bay Area – the most expensive housing market in the state with five of the nine counties topping $1 million, including $2.08 million in San Mateo – boasts better-than-average affordability rates, thanks to higher incomes, especially with Ai-related paydays.
Affordability rate by county for Q3 2025
| City/County | Q3 affordability rate | Household income needed | Monthly mortgage payment |
|---|---|---|---|
| California | 17% | $223,600 | $5,590 |
| Bakersfield | 31% | $100,800 | $2,520 |
| Fresno | 30% | $111,600 | $2,790 |
| Los Angeles | 12% | $240,400 | $6,010 |
| Orange | 13% | $352,800 | $8,820 |
| Redding | 35% | $94,400 | $2,360 |
| Riverside | 23$ | $157,600 | $3,940 |
| Sacramento | 28% | $138,400 | $3,460 |
| San Diego | 13% | $254,400 | $6,360 |
| San Francisco | 22% | $409,600 | $10,240 |
| San Jose | 19% | $482,400 | $12,060 |
| San Luis Obispo | 13% | $234,000 | $5,850 |
| Stockton | 29% | $137,200 | $3,430 |
Source: California Association of Realtors

The Bay Area is one of the metro regions with the fewest homes sold during the past nine months in the U.S.
Ratio of homes sold drops to 30-year low
Looking to buy a house? Good luck.
Nationwide, the fewest homes sold during the first nine months of the year in about 30 years – and California led the way.
Six of the seven cities with the lowest number of homes sold per 1,000 homes were in California, including Los Angeles, San Francisco, San Jose, Anaheim, Oakland, and San Diego. New York City had the fewest homes sold per 1,000 in the U.S.
Seven of eight cities in the state had a decline in home sold from January through September compared to the same nine-month period in 2024, according to Redfin. Only San Francisco had more homes sold than a year ago (see table, below).
“America’s housing market is defined right now by caution,” said Chen Zhao, head of economics research for Redfin. “Buyers are walking away from deals more often, sometimes due to affordability issues and sometimes because they’re re-evaluating whether now is the right moment to commit. Others aren’t even shopping, waiting instead for prices or mortgage rates to come down.
A BUYER-SELLER STALEMATE
Only 28 of 1,000 homes sold during the first nine months of the year, with Virginia Beach, Va., boasting the most at 35.2. All eight cities surveyed in California had much lower rates than the national average, according to Redfin.
While buyers are holding off, many homeowners are keeping their homes.
“On the other side, many sellers are staying put – either because they’re locked into low rates or unwilling to accept offers below expectations,” Zhao said. “When both sides hesitate, sales naturally fall to historic lows.”
| City | Homes sold per 1,000 ’25 | Homes sold per 1,000 ’24 |
|---|---|---|
| Anaheim | 15.5 | 16.3 |
| Los Angeles | 11.5 | 11.8 |
| Oakland | 15.9 | 16.3 |
| Riverside | 23.3 | 24.6 |
| Sacramento | 20.0 | 20.3 |
| San Diego | 16.3 | 16.7 |
| San Francisco | 13.2 | 12.9 |
| San Jose | 14.8 | 15.8 |
Source: Redfin

ADOBE STOCK
Fewer homeowners are ‘equity rich’
A dip in prices has lowered the percentage of homeowners considered “equity rich,” where equity exceeds the money owed on a mortgage.
Almost 54% of homeowners in California were equity rich during the third quarter, compared to 58% a year ago, according to ATTOM Data. But before homeowners become overly concerned, six of the eight cities surveyed exceeded the national average of 46.1%.
San Jose boasts the highest percentage of equity-rich homeowners nationwide at 66%, compared to 69% a year ago. Los Angeles finished in fourth place at 61% (see table, below).
FEW OWNERS HAVE UNDERWATER MORTGAGES
California is following a national trend, where equity has fallen in many states and cities.
“Over the past year, the share of equity-rich homes has eased slightly while the portion of seriously underwater properties has edged up,” said ATTOM CEO Rob Barber. “After several years of strong equity growth that peaked in 2022, homeowner equity levels appear to be stabilizing. The modest fluctuations seen over the last few quarters may suggest a housing market that’s finding balance after an extended period of appreciation.”
In California, the percentage of seriously underwater mortgages remains near a record low. Only 1.6% of homeowners with a mortgage are considered seriously underwater, with the highest rate in Sacramento at 2.1%. Only 0.8% of homes in Silicon Valley are seriously underwater.
Nationwide, 2.8% of homes are seriously underwater, up from 2.5% a year ago. Still, extremely low compared to the historic average.
More than one of every three (34%) of homeowners is mortgage-free in California – and don’t have to worry about being equity rich or underwater on their home loan, according to the U.S. Census Bureau.
| City | Equity rich Q3 ’25 | Equity rich Q3 ’24 | Underwater mortgages Q3 ’25 |
|---|---|---|---|
| California | 53.8% | 57.7% | 1.6% |
| Bakersfield | 40.5% | 43.7% | 2.0% |
| Fresno | 46.1% | 48.3% | 2.0% |
| Los Angeles | 60.5% | 63.9% | 1.3% |
| Riverside | 47.7% | 52.3% | 1.6% |
| Sacramento | 43.2% | 47.8% | 2.1% |
| San Diego | 59.7% | 64.1% | 1.1% |
| San Francisco | 54.6% | 58.4% | 2.0% |
| San Jose | 65.8% | 68.7% | 0.8% |
Source: ATTOM Data


